


Australian Vaccination Rate
DRAFT RESOURCE - this a live document. Comes complete with spelling mistakes and incoherent reasoning. It's subject to change without notice. Use this KRAP at your own risk.


I wanted to quickly set something up as a link that I could reference or point to when people say, “97.4% of Australian’s are vaccinated, that’s why there are so few deaths in the un-vaccinated, it’s so obvious.” I don’t believe this headline figure because it might be true on face value but it’s misleading. The claimed 97.4% depends on what number you use as the population (denominator) and also on how you class or group those that are "eligible" for the vaccine.
I hate it when people say, “the numbers speak for themselves” as it is generally not true, all charts and tables need an explanation, but the chart above does sort of speak for itself, it’s just a graphical representation of data from the first source1 with the population (denominator) back calculated from health.gov.au data, I also had to obtain some population data from a second source2 because no total population was given in the first source to calculate the baseline population for each group.
The health.gov.au numbers don't quite add up with the census, it's not a big deal, they should be close but the way the figures as tabled on the health.gov.au website are slightly misleading. I've graphed their data in figure 1 (above) so it's easier to distinguish the groups rather than read their tables. Their figures don't quite gel with 2021 census data populations in table 1 (below). I’ve recalculated the health.gov.au using the census data to produce figure 2 (below).

I originally thought I’d get a lower vaccination rate (well I did for most of the categories) using the ABS population estimate but I was surprised to find that the adult population that has received at least 1 jab went up 2.1 percentage points from 97.4% to 99.5%. I suspected that they had used a smaller denominators to inflate the vaccination rate which is true in all of the other categories but not the headline number. They look to have actually deflated it, I think this is to make it look more believable. The vaccination rate is especially important because it is often claimed that the vaccinated in Australia are just dying in proportion to their relative population, which is somehow supposed to justify the effectiveness of the vaccine, even if this were true, it would just mean the vaccines don’t work. If you inflate the proportion vaccinated you are essentially increasing the calculated effectiveness. I believe that they appear to be mostly increasing the vaccination rate in their tabulated data for this reason. Figure 3 below shows the two charts together for easier comparison, their not that much different except for the 4 dose category which shows a huge difference in some categories.

I also plan on breaking out NSW on its own at a later date as it has the best data available in Australia for comparison, but that will take a bit more time as I need to get more detailed census information.
Another good source for Australian covid-19 data is naturally enough covid19data.com.au which has slightly different values3 for Australian vaccination rates. It’s my go to source for Australian pandemic related data. It’s not always 100% accurate but usually close enough for a KRAP analysis. They’ve stopped updating a lot of their data tables as the government stops releasing information, it’s also run by volunteers as far as I can tell so they may also have lost a few volunteers that help update the tables.
Definitions:
Adults - persons aged over 16 (>16 y.o)
Kids - persons aged between 5 and 15 (5 y.o <age> 15 y.o)
Eligible - eligibility is based on being the correct age to be included in the category (a more detailed explanation is given below)4. In general;
everyone over the age of 5 is eligible for 1 & 2 Doses,
everyone over the ages of 16 is eligible for 3 doses, and
everyone over the age of 30 is eligible for 4 or more doses.
Please note these are my definitions and not those used by health.gov.au, they look to be playing silly buggers with their definition of “eligible” as well as shifting around age bands. Back calculating their estimate of the Australian population I get:
25,641,244 (back calculation of their data + 1,463,817 ABS Kids < 5 y.o.) which gives a total population of 218,456 (0.86%) greater then the ABS 2021 census (25,422,788), which is bugger all. It’s exactly the difference in the values shown in table 1 row F below (1,463,817 - 1,245,361), for obvious reasons (well maybe not obvious until you do the math).
Out of curiosity, I’ve tried to compile my own population estimate5 and I get about 25,500,000 +/- 120,000. The back calculation above of 25,641,244 is about the same as the upper end of my the credible range. However, the period when most Australian’s were vaccinated happened at a time when the population was at the lower end of the credible range, if they used a figure at the lower end of the credible range they would probably have got a %Vaccinated figure greater than 100% may result which would not have been credible.
I wish I’d found the ABS Population page6 before I started down this rabbit hole, they've pretty much done everything I did plus broken it out into age groups. A reworked calculation using their estimates is also included in chart in footnote 6 (below). It's not that different to figure 1 based on health.gov.au back calculation for 1 and 2 Doses and is very similar to my figure 2 (above) based on the ABS census data for doses 3 and 4. I was amazed at how much the Australian population fluctuates based on just inward and outward travel. I've included the link to Overseas Arrivals and Departures, Australia7 in case anyone is interested in looking it up, the dramatic change due to border closure accounts for over 2% variation in the Australasian population.
So what does it look like they’ve done:
Decreased the population “eligible” for the 4th shot by playing silly buggers with the eligibility criteria. My guess is they’re treating eligibility like a customer loyalty scheme and only counting those eligible for the 4th shot as those eligible for an “upgrade”, i.e. received their 3rd shot 6 months ago and are over 30 years of age. My definition is more market penetration. i.e. what percentage of potential customers actually drank the Kool-Aid.
Increased the population over 16 by 2.1% which may be a reasonable estimate of population growth. The ABS data would suggest to me it was pretty flat, this looks a little suspicious. Over 60 y.o were over-counted8 by about 1% and under 60 y.o. were under-counted by about the same percentage.
Decreased the number of kids eligible by 5.1%, this looks like bullshit to me, but they may have a better estimate of this age band than I do, as their large single population bin straddles three ABS population bins. I’ve just assumed that the ABS population bin is evenly distributed across the 15-19 y.o. category and split it proportionally which is my best estimate but they probably have access to population estimates.
The total population estimate of 25,641,244 and growth of (0.86%) I’ve calculated is based on the under 5 y.o. population remaining constant, i.e. I’ve assumed the birth rate is about the same as historical average, my estimate would vary slightly if this assumption is incorrect. ABS data actually suggests the under 5 population was under-counted by 1.7%, making the health.gov.au figures even less credible in my opinion.
The vaxxed remain immortal because they are never subtracted from the number of people vaccinated when they die, so this figure and percentage will always be ratcheting up as more people get vaccinated. (***check how many people have died and how many have been vaccinated to date this may explain some/all of high vaccination rate. If this works out correct change title to a more click baitey title like “Australian Vaccinated Dead or Alive?”***).
Population Estimate:

Some Early Remarks:
Still crunching and checking the numbers but some interesting things result when using the ABS Census 2021 Population.
99.5% of adults over the age of 16 are supposedly vaccinated!
That leaves only 110,756 individuals over the age of 16 that have not received at least one jab. Does such a low number sound credible?
Just like Glen 20 kills 99.9% of germs, I’m 99.9% sure health.gov.au is full of shit (Glen 20 may also be full of shit but it at least it smells nice).
Some possible explanations for such a high percentage of vaccinated may be due to;
counting of Australian external territories like Norfolk Island, Christmas Island, Norfolk Island, Cocos (Keeling) Island etc. but they add up to two tenths of bugger all with a combined population of approximately 5,000.
We may have vaccinated foreigners residing in Australia who have now left the country. The total number of vaccinated adults is 274,358 more than the total for all the states combined. Where do these people live or more importantly where did these people die? ABS data would suggest that about 100,000 people left the country between the start of the vaccine rollout and November 2021. Were these people mostly vaccinated?
Which brings me to my next point, how many of the vaxxed have died? If the death are mainly in the vaccinated you’ve got an extra 13,641 counted in the vaccinated group, but this is too small to make a difference.Population growth may partially explain the discrepancy, maybe their figures have population growth and age shifting between categories accounted for. I’ve had a quick look at ABS demographic data and don’t see much change. I doubt there was much growth in population or a major shift in age demographics during the rollout, but I’d be happy to hear from anyone that knows for-sure.
The vaxxed remain immortal because they are never subtracted from the number vaccinated when they die, so this figure and the percentage will always keep ratcheting up as more people get vaccinated. I calculate that over 300,000 people have died of all causes between Feb 2021 and Dec 2022. Over 500,000 people were also born9 in the same period. Most of the people that died were old10 and therefore most likely to have been vaccinated and newborns are of course not vaccinated against COVID-19, failing to remove the deceased and failing to add in newborns is probably the largest cause of the inflated vaccination rate shown by health.gov.au. (***If this works out to be correct change title to a more click baity title like “Australian Vaccinated Dead or Alive?”***).
A combination of all of the above and probably some others I haven’t thought of. Please feel free to leave a comment if you have any suggestions or can see any flaws in my assessment.
Wouldn’t it be great if the ABS or the Department of Health and Aged Care or the state governments would just release age stratified data for vaccinations, cases, hospitalisations and death instead of continuing to play a shell games with the data. Please move along, nothing to see here, the vaccines are Safe & Effective(TM), you can absolutely trust us on this. You don’t need to see any supporting data, just do as you’re told.
This constant shell game is really beginning to shit me,
pretty much sums up my thought's on this shell game and the cover-up in his latest article titled "The Shipman Line." I find it particularly concerning because this bullshit is going on in my home state of NSW and I'm pretty sure the same thing is going on elsewhere.Data Visualisation
To help visualize the number adult un-vaxxed I’ve calculated. I’ve included a picture of one of our biggest stadiums that was seen by many all over the world during the 2000 Sydney Olympics. If we put every unjabbed Australian over 16 into the stadium you wouldn’t even beat the attendance record, it’s a big stadium but small when compared to the population of Australia. It’s also about the population of the City of Ballart in rural Victoria, which ain’t a big town. Also, you can get an idea of what the number of people that have died in Australia (13,641) with or from COVID-19 looks like. The number of people dead (with or from COVID-19 by 30 November 2022) is about the number of people that would fit in the rectangular stand between the arches and blue light posts sticking up in the back and centre of the photo towards the top.
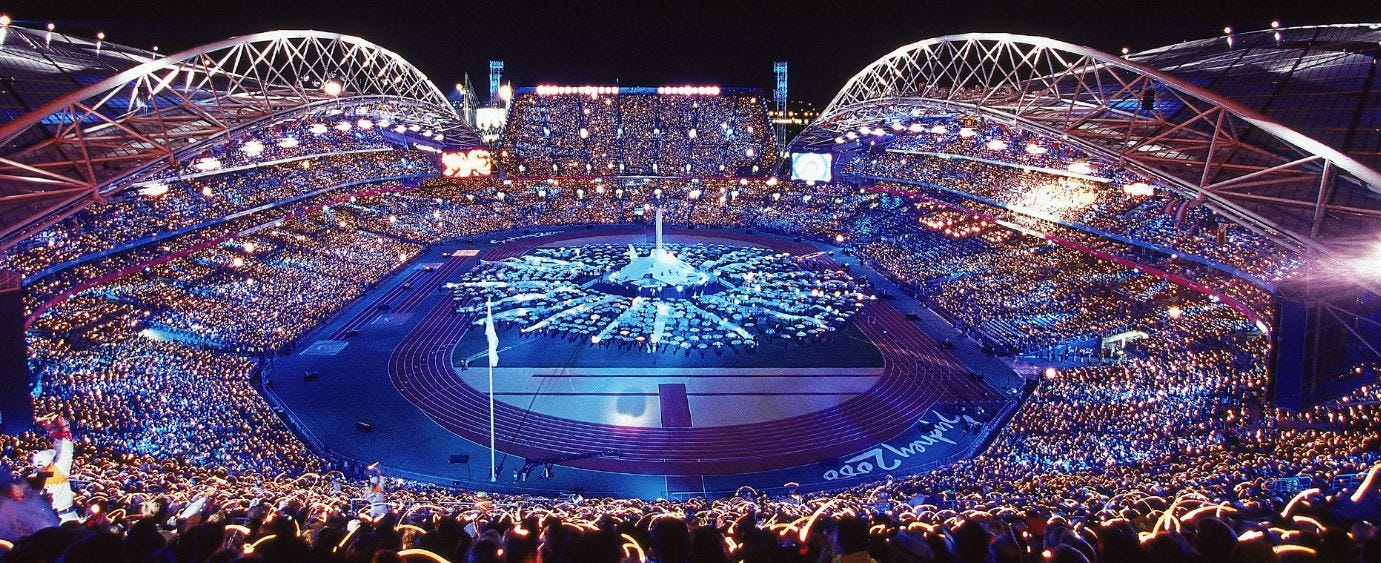
The opening ceremony for the 2000 Summer Olympics at Stadium Australia completely sold out all 110,000 seats, while the highest attendance for any event in modern Olympic Games history was recorded with 114,714 at the stadium for the closing ceremony of the same Games. Musical acts for the closing ceremony were a "who's who" of Australian music including Kylie Minogue, John Williamson, John Paul Young, Jimmy Barnes, Midnight Oil, INXS (with Jon Stevens), Men at Work, and Slim Dusty who sang Waltzing Matilda. Also in attendance on stage during the Closing ceremony were other famous Australian's including golfer Greg Norman and comedian-actor Paul Hogan.
Mistakes:
Please feel free to add any mistakes you see in the comments. I’ll update this section as I find then and any I see in the comments (if I get any).
Mislabeling - figure 1 orange bar is mislabeled in the legend, it should be “the kids” i.e population between 5 and 15. (***need to fix this***)Figure 1 changes slightly with new population estimate of 25,641,244, consider changing figure due to round off error or remove data labels as difference is very small and would not be picked up by eye.
Well not really a mistake, more a waste of time. After calculating all of the above and trying to find out how they got their figures, I wished I'd found one of health.com.au's pages earlier. The roll-out reports used to just be a short pamphlet with bugger all information. Who would have thought they actually do release their calculations. After the 25 July 202211 they release granular details of vaccination status by age and state. The more detailed reports uses an estimated population (ERP) of June 2020 which is probably fair enough as it may be the best estimate they had for the population at the time. The individual vaccination roll-out pdfs can be found at COVID-19 vaccination roll-out update12 and they also include their data files13. The sentiment surveys14 also look interesting, less than half of all Australians's were concerned about COVID-19 for most of the pandemic, it took Omicron to push it slightly over the 50% mark. An even better resource was found at Coronavirus (COVID-19) case numbers and statistics15 which updated the population and removed many of my concerns regarding the data above. It's probably a fair estimate except for 30+ which I think probably uses a convoluted definition for those 'eligible'.


Data Sources:
Vaccination numbers and statistics
This page contains data about Australia's COVID-19 vaccine rollout.
Last updated: 5 December 2022, Accessed 8 January 2023
Australian Government - Department of Health and Aged Care
We develop and deliver policies and programs and advise the Australian Government on health, aged care and sport. We work with a wide range of stakeholders to ensure better health for all Australians.
https://www.health.gov.au/our-work/covid-19-vaccines/vaccination-numbers-and-statistics
Australia 2021 Census All persons QuickStats
Latest release: Accessed 8 January 2023
Australian Bureau of Statistics (abs.gov.au)
https://abs.gov.au/census/find-census-data/quickstats/2021/AUS

Staying up to date with COVID-19 vaccination
The Australian Technical Advisory Group on Immunisation (ATAGI) advises the Minister for Health and Aged Care on the National Immunisation Program (NIP) and other immunisation issues.
This is a little confusing, there have been multiple changes to recommendations and approvals, below are the generally accepted norms used to make the rule of thumb definitions above. If you or one of your loved ones is planning on getting vaccinated don’t take the information below as gospel, consult the website or better still a medical practitioner, it’s confusing and difficult to navigate with contradicting advise depending which page or revision you look at.
People aged 16 years and older
Everyone aged 16 years and older is recommended to receive a COVID-19 vaccine booster dose to maintain an ‘up to date’ status.
This booster dose is now recommended from 3 months after the last primary dose. This is called the ‘due date’.
Initial protection is reduced, and increased waning is evident following primary COVID-19 vaccination (usually 2 doses) against the Omicron variant. This warrants the inclusion of booster doses in a person’s up to date status.
For individuals aged 5 to 15 years
Receipt of a homologous or heterologous primary schedule of two doses of any TGA approved or TGA recognised COVID-19 vaccine at least 14 days apart. A booster dose is currently not required. ATAGI will update advice on up-to-date status if and when boosters are recommended for children and adolescents in these age groups
You are eligible for a COVID-19 booster dose if you:
are 5 to 15, and:
are severely immunocompromised, or
have a disability with significant or complex health needs, or
have severe, complex, or multiple health conditions that increase the risk of severe COVID-19
are 16 years and older, and
completed your primary dose course of COVID-19 vaccination at least 3 months ago.
If you have had COVID-19 you should wait to be vaccinated with a COVID-19 vaccine for 3 months after your confirmed infection.
The date you had your last COVID-19 vaccine is on your COVID-19 digital certificate.
An additional booster, is recommended for people at increased risk of severe illness, to be given 3 months after their first booster dose.
This additional booster will be a fourth dose for most people and a fifth for people who are severely immunocompromised.
You should get an additional booster if you are:
50 years or older
16 years or older and a resident of an aged care or disability care facility
16 years or older and severely immunocompromised
Aboriginal or Torres Strait Islander and aged 50 years and older
16 years or older with a medical condition that increases the risk of severe COVID-19 illness
16 years or older with a disability.
ATAGI has advised people aged 30 to 49 years old can receive an additional booster if they choose.
Healthy people aged 16 years to under 30 years who do not have risk factors for severe COVID-19, are not currently recommended to receive an additional booster dose. Evidence shows that protection against severe disease, rather than all infection, is well maintained in young healthy people.
Australian Population Estimate

Correction: 20 March 2023 - Vaccination Rollout Begins 22 Feb 2021 not 10 Aug 2021 as originally labeled, arrow was shown correctly but label was incorrect.
ABS Population Page
https://www.abs.gov.au/statistics/people/population
National, state and territory population
Released: 15/12/2022
Latest release Data download
Statistics about the population and components of change (births, deaths, migration) for Australia and its states and territories


Overseas Arrivals and Departures, Australia
Latest release Data download
Statistics on international travel arriving in and departing from Australia.
Released: 17/01/2023 Accessed: 29/01/2023
2021 Census overcount and undercount
Released: 28/06/2022 Accessed: 29/01/2023
2021 Census overcount and undercount, 2021 | Australian Bureau of Statistics (abs.gov.au)
Births, Australia
Released: 25/10/2022 Accessed: 29/01/2023
Reference period 2021
Births, Australia | Australian Bureau of Statistics (abs.gov.au)
Deaths, Australia
Latest release Data download
Statistics about deaths and mortality rates for Australia, states and territories, and sub-state regions
Released: 29/09/2022 Accessed: 29/01/2023
Reference period 2021
Deaths by Age and Sex in Australia

COVID-19 Vaccine Roll-out 25 July 2022
Released: 25/07/2022 Accessed: 31/01/2023

COVID-19 vaccination rollout update
Australian Government - Department of Health and Aged Care
Presentations containing high-level data about Australia's COVID-19 vaccination roll-out program.
COVID-19 vaccination – vaccination data
Australian Government - Department of Health and Aged Care
These data files contains statistical data about Australia's COVID-19 vaccinations.
Operation COVID Shield COVID-19 Vaccine Sentiment Summaries
Australian Government - Department of Health and Aged Care
These monthly summary reports track COVID-19 vaccination sentiments across Australia.
Basically market research done by the government during the roll-out, interesting stuff.


Updated: 30 September 2023
Full Sentiment reports can be found at
treasure trove of FOI information.
Coronavirus (COVID-19) case numbers and statistics
Australian Government - Department of Health and Aged Care
This page provides updates on national COVID-19 weekly current trends.
https://www.health.gov.au/health-alerts/covid-19/case-numbers-and-statistics
Where was this information during the critical stage of the pandemic. Looks like they kept it nicely hidden. I accidentally stumbled across it looking for something else.

Technical notes
From 7 October 2022, there is a change in series to update the COVID-19 vaccination reporting to better reflect current circumstances providing a more accurate and up to date representation of the level of protection in the population. Changes include:
Updated population denominator used for general coverage to the latest release of the Australian Bureau of Statistics Estimated Residential Population (2021)
Removed from all coverage calculations individuals who are no longer in scope for the vaccination rollout (i.e. deceased or permanently left Australia)
Included doses that may have been administered internationally where the vaccine brand is recognised by the TGA and recorded into the Australian Immunisation Register.