I was just looking through some information today regarding Hospital Admission in Australia and found the above table. I was going to do a write up on this in the future and some other interesting figures I found once I’ve got my head around it.
I was prompted to just put this out for comment by the latest post from
(check it out in the link below). I had seen this code used to code deaths previously, but there was very little new death information because deaths were already in the Australian Database of Adverse Event Notifications (DAEN) and covered by others previously elsewhere.
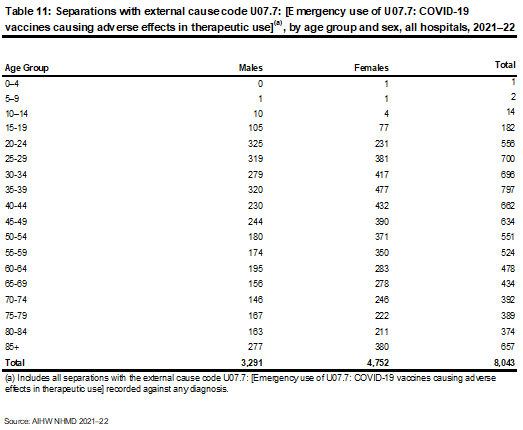
What I found most alarming about the table was the ratio of females to males in regards to adverse events. The table is for July 2020 to June 2021 (I think) so it only covers less than 15% of the Australian roll-out. If this is accurate and I haven’t misinterpreted it. It’s pretty shocking.
I can’t remember anyone else covering this, maybe they have, but I missed it, I only just became aware of it’s existence.
Sorta matches fertility range… Would wonder if the males are being redistributed to other codes. For example the various heart conditions being not flagged as shot related. Menstruation change though more likely tieable to a shot that happened in the last <4 weeks…
Yep, pretty much my first thought, but I don’t want to jump the gun. There’s a bunch more stuff where I found this. I only just found it this afternoon while looking for something else.
To put the 2,049 Hospitalized Adverse Events (separations*) into context there were only 4,718 Diagnosed Hospital separations WITH COVID-19 during the same reporting period (43%). They kept that under their hats pretty well. That's in 5 months of jabbing vs 12 months of COVID. To be fair there was a very low prevalence of COVID at the time.
Also, works out at roughly 2.73 people per 10,000 doses Hospitalized with adverse events. Although you could have same person present multiple times, so it's not that simple.
*Separations = admitted -> discharged (recovered) or dead.
Ivo, this is well spotted. Gee we really have to dig for the data. I didn't know the ICD code was included in the DAEN records. Is it all under this U07.7 code? The other thing I can think of is that since this only the start of the jab rollout, ie till June 2021, those first in line of working age were healthcare workers and aged care workers, who are mainly female. I recall seeing something about this a while back.
Hi Andrew, this isn’t from DAEN records. It’s from a health site that monitors performance of the health system (hospitals). I’ll send you a DM with the links. I want to look around the site and download all their data before I post a public link in case it disappears.
You’re right about the demographics and the fact they are probably health care workers so the results are probably skewed female and it probably also has a reporting bias i.e. if your working in a hospital you’re probably more likely to get a colleague to give you a check up and it gets recorded as a hospital visit because the consultation is probably billed to Medicare as a hospital outpatient. I was looking through the site to try and debunk the “missed treatment/visits” causes excess deaths hypothesis and found the table above in one of their spreadsheets.
Was just watching the video. Yes looks like 2 times for adverse events in women up to May 2021. He looks very annoyed when he shows Whitty talking about boosters and the 100,000s of thousands Needed to Vaccinate
Wow, that is a nice find. Their API is interesting https://myhospitalsapi.aihw.gov.au/index.html . I just scraped a whole lot of data from it (682 MB of .json files) and hopefully see if there is anything useful in there.
Thanks for the heads up. I didn’t see their API, good to know. There is another site which has a nice visualization tool for NSW but it is copyrighted. I think they just pull their data from there and graph it, should be easy enough to reproduce their graphs without breaching copyright if I find anything interesting.
I haven't had a chance yet to see if there is anything interesting yet in the dataset. I suspect the most interesting locations will be where there was almost no COVID-19 for a long time and lots of vaccination, so South Australia, Western Australia and Queensland.
That’s great. There is some interesting stuff but not sure how to frame it. My main interest was in looking at how the health system was performing. I keep reading about hospitals overwhelmed and missed treatment etc. as the cause of excess deaths. It doesn’t look like that to me from what I’ve seen so far, but maybe I’ve missed something. There is a lot of data there. I found the adverse event table by accident.
I like your adverse events information. I was going to scrape DAEN to see what I could find there and compare it to the table above. Your information just saved me the time/trouble, particularly the pivot table. I was trying to think of a way to get it into the format you’ve already provided so I could query it more easily.
I agree the non-covid states are particularly interesting. I’m very interested in WA but public data seems pretty thin.
I found it buried in one of their spreadsheets about health outcomes in hospitals from memory. I was looking for something else and stumbled across it. Mainly, I don’t buy the line about avoided health services, appointments etc. being responsible for excess deaths and was looking for evidence in the number of hospital visits etc. and never got around to analyzing it in detail. There is a lot of data there and I don’t have enough spare time to go through it all. The table has the source at the bottom maybe a search on the numbers “AIHW NHMD 2020-21” might help you locate it again if you’re still interested. I’m pretty sure I’ve got the original spreadsheet archived somewhere if you can’t find it and are still interested. The coloured section is my own calculation to let me see visually where the “hot spots are”.


Sorta matches fertility range… Would wonder if the males are being redistributed to other codes. For example the various heart conditions being not flagged as shot related. Menstruation change though more likely tieable to a shot that happened in the last <4 weeks…
Yep, pretty much my first thought, but I don’t want to jump the gun. There’s a bunch more stuff where I found this. I only just found it this afternoon while looking for something else.
To put the 2,049 Hospitalized Adverse Events (separations*) into context there were only 4,718 Diagnosed Hospital separations WITH COVID-19 during the same reporting period (43%). They kept that under their hats pretty well. That's in 5 months of jabbing vs 12 months of COVID. To be fair there was a very low prevalence of COVID at the time.
Also, works out at roughly 2.73 people per 10,000 doses Hospitalized with adverse events. Although you could have same person present multiple times, so it's not that simple.
*Separations = admitted -> discharged (recovered) or dead.
Ivo, this is well spotted. Gee we really have to dig for the data. I didn't know the ICD code was included in the DAEN records. Is it all under this U07.7 code? The other thing I can think of is that since this only the start of the jab rollout, ie till June 2021, those first in line of working age were healthcare workers and aged care workers, who are mainly female. I recall seeing something about this a while back.
Hi Andrew, this isn’t from DAEN records. It’s from a health site that monitors performance of the health system (hospitals). I’ll send you a DM with the links. I want to look around the site and download all their data before I post a public link in case it disappears.
You’re right about the demographics and the fact they are probably health care workers so the results are probably skewed female and it probably also has a reporting bias i.e. if your working in a hospital you’re probably more likely to get a colleague to give you a check up and it gets recorded as a hospital visit because the consultation is probably billed to Medicare as a hospital outpatient. I was looking through the site to try and debunk the “missed treatment/visits” causes excess deaths hypothesis and found the table above in one of their spreadsheets.
Possibly also due to AZ being given. Latest Dr John YouTube video. 3:46 see difference in adverse effects on his chart.
https://youtu.be/onNe5VMQAwQ
Was just watching the video. Yes looks like 2 times for adverse events in women up to May 2021. He looks very annoyed when he shows Whitty talking about boosters and the 100,000s of thousands Needed to Vaccinate
Example of coding practice for covid related hospitalization:
Example17
https://www.healthywa.wa.gov.au/~/media/Files/Corporate/general-documents/Clinical-coding/Guides-and-summaries/guid_COVID-19.pdf
Wow, that is a nice find. Their API is interesting https://myhospitalsapi.aihw.gov.au/index.html . I just scraped a whole lot of data from it (682 MB of .json files) and hopefully see if there is anything useful in there.
Thanks for the heads up. I didn’t see their API, good to know. There is another site which has a nice visualization tool for NSW but it is copyrighted. I think they just pull their data from there and graph it, should be easy enough to reproduce their graphs without breaching copyright if I find anything interesting.
I put the collected dataset up here https://github.com/AccAEN/AccessibleAdverseEventNotification/tree/main/data/AIHW
I haven't had a chance yet to see if there is anything interesting yet in the dataset. I suspect the most interesting locations will be where there was almost no COVID-19 for a long time and lots of vaccination, so South Australia, Western Australia and Queensland.
That’s great. There is some interesting stuff but not sure how to frame it. My main interest was in looking at how the health system was performing. I keep reading about hospitals overwhelmed and missed treatment etc. as the cause of excess deaths. It doesn’t look like that to me from what I’ve seen so far, but maybe I’ve missed something. There is a lot of data there. I found the adverse event table by accident.
I like your adverse events information. I was going to scrape DAEN to see what I could find there and compare it to the table above. Your information just saved me the time/trouble, particularly the pivot table. I was trying to think of a way to get it into the format you’ve already provided so I could query it more easily.
I agree the non-covid states are particularly interesting. I’m very interested in WA but public data seems pretty thin.
where does this table come from?
Not sure if the information is still relevant to you. Just saw you comment sorry I missed it back in May. The table is from AIHW
https://www.aihw.gov.au/
I found it buried in one of their spreadsheets about health outcomes in hospitals from memory. I was looking for something else and stumbled across it. Mainly, I don’t buy the line about avoided health services, appointments etc. being responsible for excess deaths and was looking for evidence in the number of hospital visits etc. and never got around to analyzing it in detail. There is a lot of data there and I don’t have enough spare time to go through it all. The table has the source at the bottom maybe a search on the numbers “AIHW NHMD 2020-21” might help you locate it again if you’re still interested. I’m pretty sure I’ve got the original spreadsheet archived somewhere if you can’t find it and are still interested. The coloured section is my own calculation to let me see visually where the “hot spots are”.
Updated: 8 October 2023.
The original source file has been added to the post.
The latest version has been included.
Both files can be downloaded from the substack post:
U07.7 Covid-19 Vaccine causing adverse events in therapeutic use.
https://krap.substack.com/p/u077-covid-19-vaccines-causing-adverse