wrote a great article regarding viral interference a while back, although I’m more included to agree with Martin, Eugy makes a good case for the viral interference model, but at least here in NSW, I just don’t see it as a plausible explanation.
It certainly wasn’t COVID-19 based on my reading of the charts below.
This post was not intended as a standalone post. My original intention was to just post it as reference so Martin and Fabian could easily see examples of the abnormalities in the NSW data without having to search through the reports, and confine the discussion to the comments section of Martin Neil’s post. I had intended to delete it but thought I would just leave it and maybe add to it if any more interesting discussions regarding the flu pop up. The link to
post was added after the discussion with Martin. I’ve added it because Eugy’s post seems to have become canon amongst the substack community in regards to an explaining why the the flu disappeared. It is a well written and well thought out post, but I also think it’s wrong.
who always has many insightful comments with regards to “covid numbers” on his stack and in the comments sections of many of my favorite stacks.
I’ve also added other posts at the end of the thread as I find them in case anyone is interested reading observations and related discussions by others.
Other good discussions regarding the flu in general can also be found at the
INFORMATION BRIEF Updated: December 2021 Reporting period: 01 January to 07 November 2021 (excerpt)
Virology
• Subtyping information was limited in 2021 due to the low number of suitable samples available for testing.
• During the reporting period, 67.7% of notifications of laboratory-confirmed influenza to the NNDSS were influenza A, of which 95.8% were influenza A(unsubtyped), 3.0% were influenza A(H3N2), and 1.2% were influenza A(H1N1). Influenza B accounted for 21.9% of notifications, 3.5% were influenza A and B coinfection, 0.5% were influenza C, and 6.4% were untyped.
• Of the 27 samples characterised by the WHOCC between 01 January and 8 November 2021, 93% (n=25) were influenza A(H3N2), 4% (n=1) were influenza A(H1N1), and 4% (n=1) were influenza B/Victoria.
• Of the 27 isolates characterised by the WHOCC for antigenic similarity to their corresponding vaccine components by hemagglutination inhibition assay, both the one influenza B/Victoria isolate and the one influenza A(H1N1) were antigenically similar to the corresponding vaccine components, while all 25 influenza A(H3N2) isolates were antigenically dissimilar to the corresponding vaccine components (low reactors).
Vaccine effectiveness
• Influenza viruses are continually changing, making the targeting of an effective vaccine a constant challenge each year.
• The small number of cases reported across systems during the 2021 influenza season in Australia precludes meaningful analysis to estimate vaccine effectiveness.
You only find influenza if you look for it (bolding is mine).
During the reporting period, the influenza notification rate has been highest in the Northern Territory (23.6 per 100,000 population), Tasmania (6.9 per 100,000 population), and Queensland (5.6 per 100,000 population). The higher notification rate in the Northern Territory in 2021 is due to testing procedures for travellers in hotel quarantine. In the Northern Territory, all travellers in quarantine are tested for influenza as well as COVID-19, whereas in other jurisdictions, those in hotel quarantine may only be tested for COVID-19.
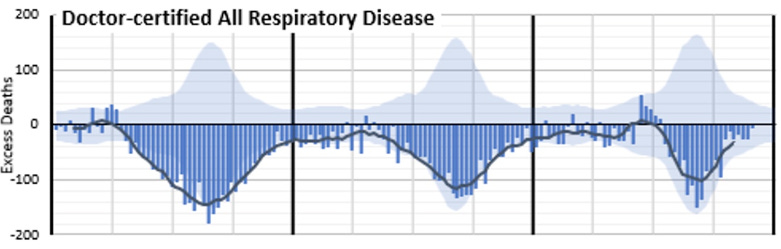
Excess Deaths from all Respiratory Disease (Australia)
Despite an increase in all 7 respiratory viruses in NSW, excess deaths from repository viruses remain at near record lows for Australia
NSW makes up approx. 32% of the Australian population. Strictly speaking the Australia excess deaths and NSW excess deaths may not be proportional. NSW deaths from all respiratory disease may have increased and the other states may have had a decreased offsetting a rise NSW. I would assume that NSW would be “typical” but it may not be. If I can find data for Doctor-certified All Respiratory Disease in NSW I’ll update the chart below with the figures.
COVID-19 Mortality Working Group: Almost 20,000 excess deaths for 2022 in Australia
Posted 6 March 2023
Excess Deaths from all Respiratory Disease (Australia) 2020, 2021 & 2022
This section was added after the discussion in the comments section.
I always thought “elimination” neant “total absence”, looks like it’s defined a bit differently sometimes by epidemiologists (bolding mine). According to the definition below it looks like influenza was eliminated in NSW and probably Australia in 2020 and 2021.
for alerting me to the fact that words don’t always mean what you think the mean. They mean no more or no less than what Humpty Dumpty defines them to be.
Elimination of an infectious disease is often understood to mean the total absence of cases in a population. This situation can occur only if the entire population is immune as a result of either natural disease or vaccination. However, this costly and unrealistic scenario is not necessary to ensure elimination, more appropriately defined as a situation in which sustained transmission cannot occur and secondary spread from importations of disease will end naturally, without intervention. The authors describe the size and duration of outbreaks caused by imported infections after indigenous transmission has been eliminated. They show that the status of the elimination process can be monitored by assessing the proportion of cases imported and the distribution of outbreak sizes. Measles in Canada, the United States, and the United Kingdom provides a good example of the relevance of these criteria. Surveillance of the size and duration of these outbreaks enables maintenance of elimination to be monitored. Am J Epidemiol 2000; 51: 1039–48.
Some more from Martin Neil with his excellent presentation to PANDA. I find his explanation at the beginning that there is a lack of evidence for viral interference very convincing and he goes onto explain some of the likely reasons for the apparent disappearance of the flu.
Hi Martin. Thanks for your reply and your original article/s, your article got me thinking about this anomaly again. I looked at it a while back and gave up digging and had pretty much lost interest in it.
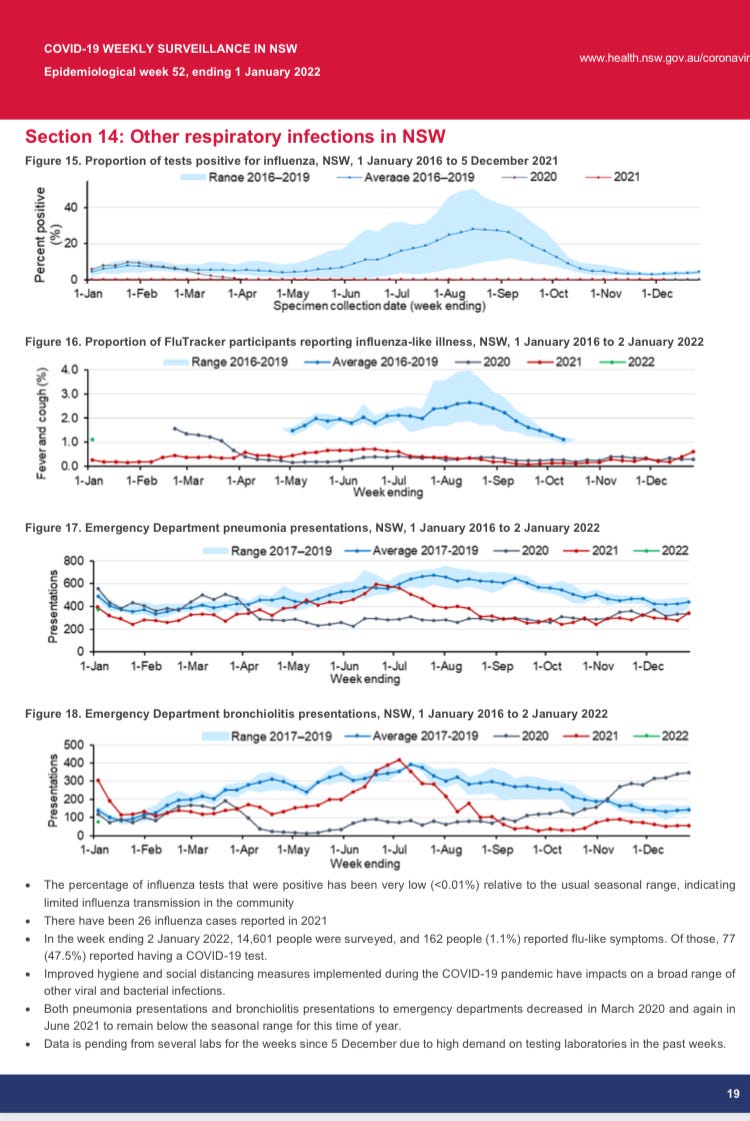
Sorry, I wasn't very clear about the ED pneumonia presentations, I should have written that it’s almost flat in 2020 from about mid April 2020 (our Autumn).
You make a very good point regarding lockdowns and ED presentations during lockdown in 2021 . You could say ED presentations track around the historical average in 2021 until they start to decline again due to the NSW lockdowns starting about July 2021.
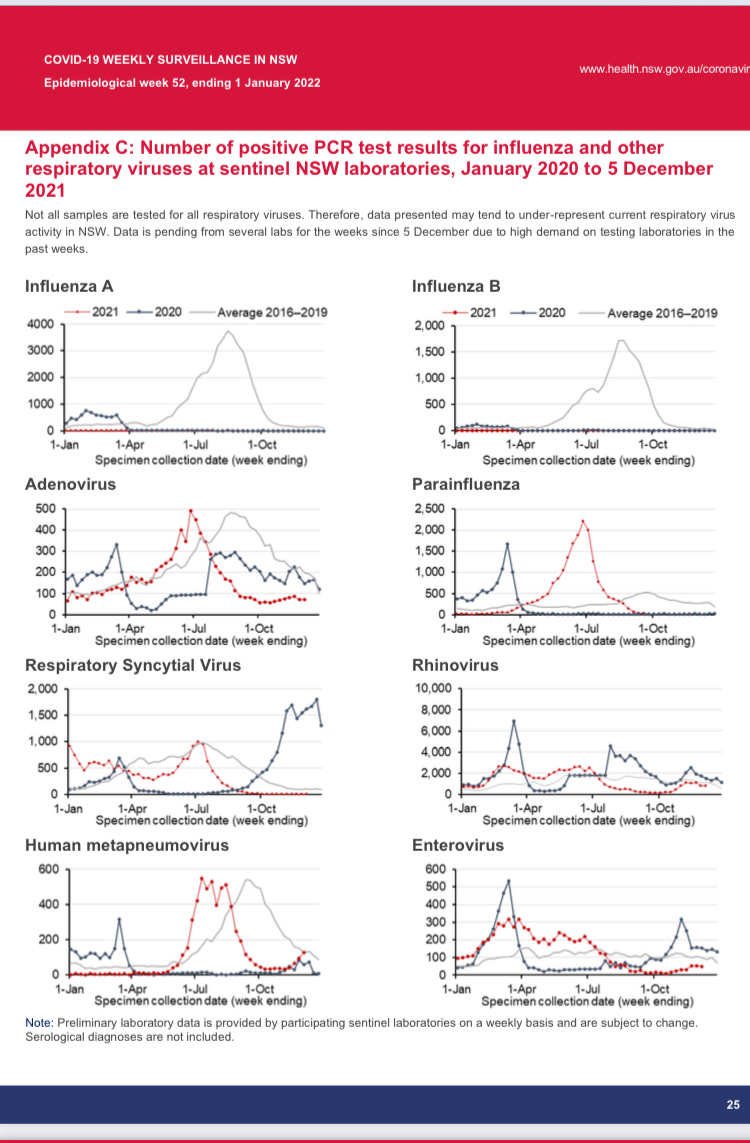
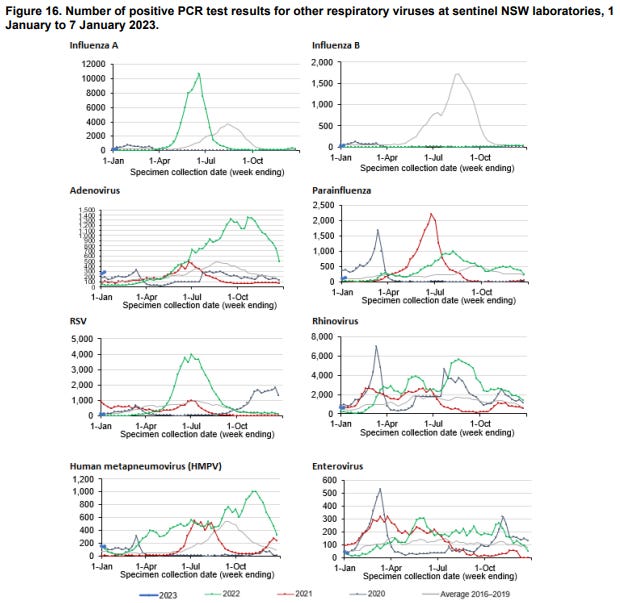
Every category of influenza and other respiratory viruses were tracking at or above the 4 year historical average in summer 2020 (some way above) then amazingly they just drop off to way below the 2016-2019 average. Apparently, they test all samples for influenza and they only test a subset of samples for the other viruses, the strange “flat bits” and “sudden jumps” could just be an artifact of how many tests were performed.
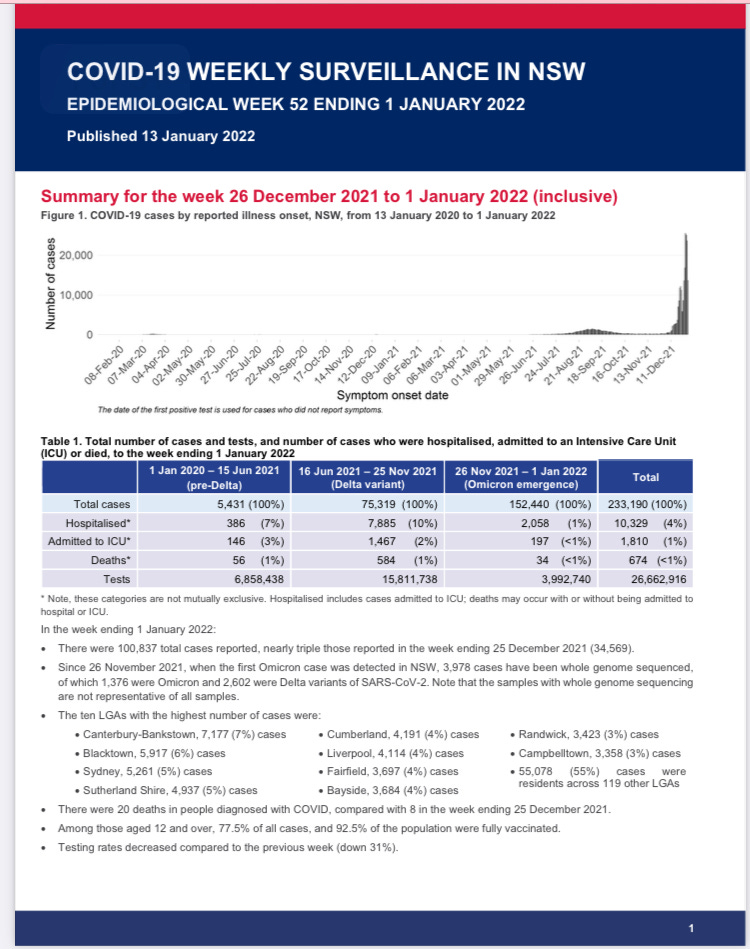
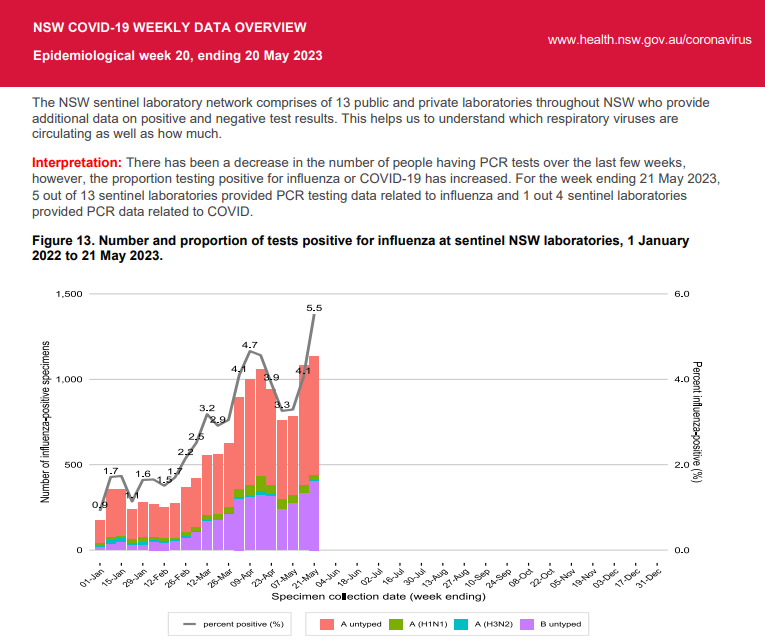
I only just noticed the note below the graphs labelled Section 14 (in the above thread), "There were only 26 cases of influenza reported in 2021". That's 26 cases in a population of 8.166 Million people, for comparison there were about 113,521 influenza A cases in reported 2019. NSW only had about 28,000 reported COVID-19 cases in 2021.
I've since found a report summarizing the 2021 season. They only managed to test 27 samples to determine the type/subtype (A, B, C, H1N1, H3N2 ), in a country of 24 Million people. Absolutely amazing (if true)! I've added a link to the report in the thread above.
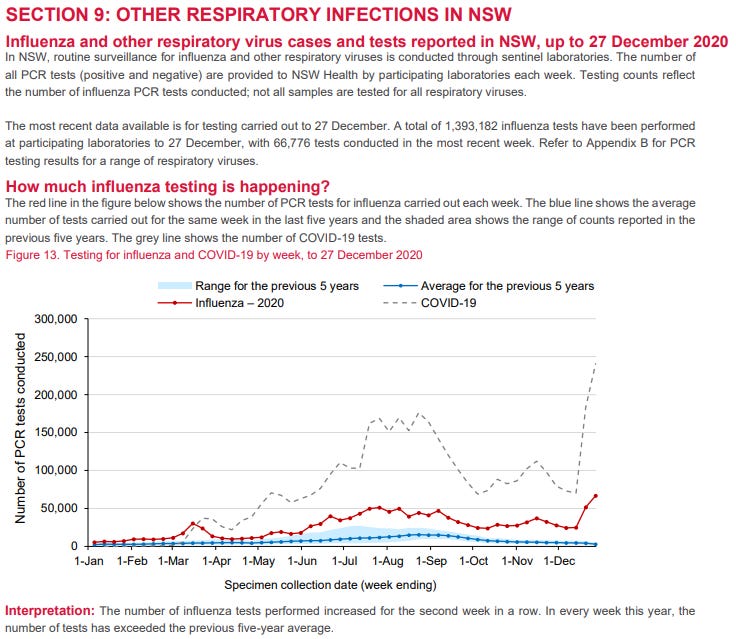
I also managed to find the number of test for influenza and they actually INCREASED. Supporting what Fabain said regarding testing not declining in Germany, same seems to be true in NSW. I've added it to the thread above (screen shot of Section 9) + some other graphs that you might find interesting.
Does this suggest:
Influenza can be “locked out” of the country by quarantine/border closures (like an invasive foreign species).
Other respiratory viruses (are like a local species) seem lay dormant waiting for a while and explode in the absence of influenza (or increased testing). So, influenza normally out competes them or maybe they just aren’t of much interest in a normal “flu year”?
Influenza makes a comeback in the winter flu season after borders re-open. Does this mean that influenza needs to be “reseeded” annually? Or, maybe, NPI are more effective at reducing influenza than other respiratory viruses?
Despite an increase in all the other 7 respiratory viruses, excess deaths from repository viruses remained at near record lows.
This makes less sense and raises more questions the more I think about at it.
Maybe, epidemiological and viral disease models are not as predictive as epidemiologists and virologists would like us to believe.
Maybe I just don't get it and have missed something fundamental.
Lots to mull over still. It's a complex multifactorial system with lots of moving parts. Academic epidemiology doesn't seem to have the tools for this and people favour simple explanations and are overconfident.
The 'flu was re-branded in 2020. Big pharma like doing that to boost sales. Most big companies do that whatever the product, 'New!, Improved!' but just the same old probable slightly smaller and more expensive.


Please see the discussion (if any) of my observations on Martin’s post (link below):
https://wherearethenumbers.substack.com/p/finding-the-flu-is-easy-just-google/comment/16596514
Hi Ivo. There us a lot of pneumonia in the data in 2020 but low flu positivity. Pneumonia never went but flu did?
Pneumonia is almost flat, with no winter peak. It actually declines a bit in our winter. Australia closed its borders on 20 March 2020.
Does that mean flu and other viruses that suddenly dropped off are all imported and pneumonia is a local phenomenon?
Why do these imported viruses then go up again without the borders re-opening borders?
NSW lockdown was July-Oct 2021 for reference.
All very strange, I can’t see any pattern that makes any sense.
It peaked in Spring 2020 and summer 2021. Not flat.
Also they are ED pneumonia presentations. If people staying at home cos of lockdowns they won't be turning up at ED unless it's severe.
Hi Martin. Thanks for your reply and your original article/s, your article got me thinking about this anomaly again. I looked at it a while back and gave up digging and had pretty much lost interest in it.
Sorry, I wasn't very clear about the ED pneumonia presentations, I should have written that it’s almost flat in 2020 from about mid April 2020 (our Autumn).
You make a very good point regarding lockdowns and ED presentations during lockdown in 2021 . You could say ED presentations track around the historical average in 2021 until they start to decline again due to the NSW lockdowns starting about July 2021.
Every category of influenza and other respiratory viruses were tracking at or above the 4 year historical average in summer 2020 (some way above) then amazingly they just drop off to way below the 2016-2019 average. Apparently, they test all samples for influenza and they only test a subset of samples for the other viruses, the strange “flat bits” and “sudden jumps” could just be an artifact of how many tests were performed.
I only just noticed the note below the graphs labelled Section 14 (in the above thread), "There were only 26 cases of influenza reported in 2021". That's 26 cases in a population of 8.166 Million people, for comparison there were about 113,521 influenza A cases in reported 2019. NSW only had about 28,000 reported COVID-19 cases in 2021.
I've since found a report summarizing the 2021 season. They only managed to test 27 samples to determine the type/subtype (A, B, C, H1N1, H3N2 ), in a country of 24 Million people. Absolutely amazing (if true)! I've added a link to the report in the thread above.
I also managed to find the number of test for influenza and they actually INCREASED. Supporting what Fabain said regarding testing not declining in Germany, same seems to be true in NSW. I've added it to the thread above (screen shot of Section 9) + some other graphs that you might find interesting.
Does this suggest:
Influenza can be “locked out” of the country by quarantine/border closures (like an invasive foreign species).
Other respiratory viruses (are like a local species) seem lay dormant waiting for a while and explode in the absence of influenza (or increased testing). So, influenza normally out competes them or maybe they just aren’t of much interest in a normal “flu year”?
Influenza makes a comeback in the winter flu season after borders re-open. Does this mean that influenza needs to be “reseeded” annually? Or, maybe, NPI are more effective at reducing influenza than other respiratory viruses?
Despite an increase in all the other 7 respiratory viruses, excess deaths from repository viruses remained at near record lows.
This makes less sense and raises more questions the more I think about at it.
Maybe, epidemiological and viral disease models are not as predictive as epidemiologists and virologists would like us to believe.
Maybe I just don't get it and have missed something fundamental.
Lots to mull over still. It's a complex multifactorial system with lots of moving parts. Academic epidemiology doesn't seem to have the tools for this and people favour simple explanations and are overconfident.
Thanks again for the reply.
Speaking of complex multifactorial systems with lots moving parts. Are you guys working on a model like you describe in:
https://wherearethenumbers.substack.com/p/weltanshauung?utm_source=substack&utm_campaign=post_embed&utm_medium=web
Or is just too time consuming to complete such a project without research funding?
No, not that one and in any case we can't get funding. Why would the state fund research that contradicts or incriminates the state?
Martin, I totally hear you there.
The 'flu was re-branded in 2020. Big pharma like doing that to boost sales. Most big companies do that whatever the product, 'New!, Improved!' but just the same old probable slightly smaller and more expensive.
https://baldmichael.substack.com/p/what-is-the-flu-aka-covid-19-and